Hydrogen research
The right energy.
At the right time.
Carbon-aware operation converts electricity variability into an operating decision.
Below the clean threshold. Hours 11–15 fall below 320 gCO2/kWh in this trace.
View all 24 hourly values
| Hour | gCO2/kWh | Below 320 |
|---|---|---|
| 00:00 | 380 | No |
| 01:00 | 360 | No |
| 02:00 | 340 | No |
| 03:00 | 330 | No |
| 04:00 | 325 | No |
| 05:00 | 330 | No |
| 06:00 | 350 | No |
| 07:00 | 420 | No |
| 08:00 | 480 | No |
| 09:00 | 460 | No |
| 10:00 | 380 | No |
| 11:00 | 300 | Yes |
| 12:00 | 260 | Yes |
| 13:00 | 240 | Yes |
| 14:00 | 250 | Yes |
| 15:00 | 280 | Yes |
| 16:00 | 340 | No |
| 17:00 | 430 | No |
| 18:00 | 520 | No |
| 19:00 | 540 | No |
| 20:00 | 500 | No |
| 21:00 | 450 | No |
| 22:00 | 410 | No |
| 23:00 | 390 | No |
Published scenarios
Three ways to operate.
| Scenario | Operating rule | Monthly CO2 per site |
|---|---|---|
| Baseline | Fixed production at 20 kg/h | 30–500 metric tons |
| Variable 1 | Tiered curtailment as grid carbon rises | 30–110 metric tons |
| Variable 2 | Produce only below 0.6 kg CO2/kg H2 | 0.1–0.6 metric tonsTasmania |
Ranges depend on state and month. Variable 2 qualifies for hydrogen tax credits in the published scenario. The scenario threshold in kg CO2/kg H2 is distinct from the grid-carbon threshold in gCO2/kWh shown above.
Clean grid
RUN
Rising carbon
CURTAIL
Dirty grid
WAIT
Systems methodology · R-02 preprint
The architecture
behind the analysis.
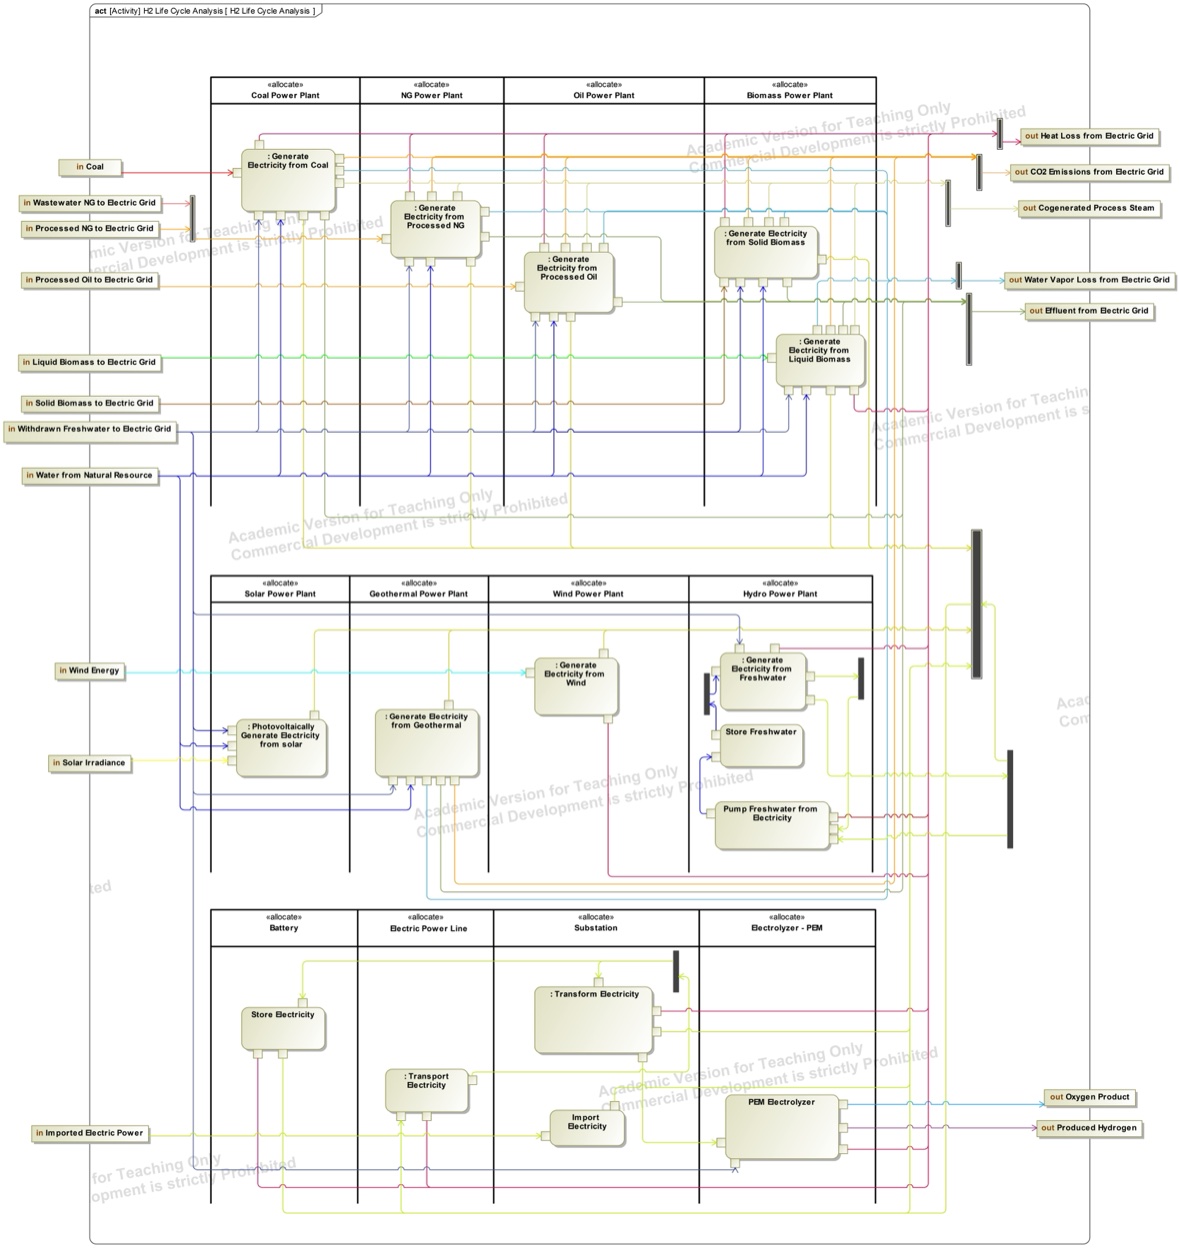
Model-based systems engineering and hetero-functional graph theory bring system structure into spatio-temporal life cycle analysis.
01 · Hetero-functional graph
Petri net.
Follow electricity from generation to hydrogen. Circles represent operands, bars represent processes, and connecting lines represent flows.
02 · SysML model
Activity diagram.
H2 Optimizer
From research
to a service.
The dispatch logic from R-01, being rebuilt as a service.
Request a demoCarbon uses EIA-930 estimates. These are not certified and not 45V-qualifying. Demo on request.