Research

Ideas worth
looking into.

1 peer-reviewed article · 2 preprints · 1 working draft.

R-01 · Peer reviewed / published

Dynamic Carbon-Aware Operation of Electrolytic Hydrogen Production in Australia: A Spatio-Temporal Life Cycle Assessment

Niraj Gohil, Nawshad Haque, Amro M. Farid

Sustainability (MDPI), Volume 18, Article 8716, published 25 August 2026

Methods: Life cycle assessment, hourly grid data, optimization, Python

Read the complete publisher abstract
The transition to sustainable energy is critical for addressing global climate change. Hydrogen production, particularly via electrolysis, has emerged as a key solution, offering the potential for low-carbon energy across various sectors. This paper conducts a spatiotemporal life cycle analysis of electrolytic hydrogen production in Australia under time-varying CO2 management schemes. Three scenarios are studied. The baseline scenario studies hydrogen production at a fixed rate of 20 kg/h, resulting in monthly carbon emissions of 30–500 metric tons of CO2, depending on the Australian state and chosen month. Variable production scenario 1 reduces hydrogen production in a tiered fashion as the grid's carbon intensity increases, resulting in monthly carbon emissions of 30–110 metric tons of CO2, depending on the Australian state and chosen month. Finally, variable production scenario 2 restricts hydrogen production to periods when the life cycle carbon intensity (LCA CO2eq) of electricity falls below a predefined threshold of 0.6 kg CO2 per kg H2, thereby qualifying for hydrogen tax credits and resulting in monthly carbon emissions of 0.1–0.6 metric tons of CO2 in Tasmania. Leveraging real-time data from the Electricity Mapping database and real-time electricity cost data from the AEMO database, the three scenarios study the effect of dynamically adjusting hydrogen output to reduce both emissions and production costs. Furthermore, the integration of hydrogen tax credits significantly enhances cost-effectiveness, offering a viable pathway for widespread adoption. This study concludes that dynamic, real-time operation, coupled with financial incentives, offers a promising approach to enhancing the sustainability and economic viability of hydrogen production.
R-02 · Preprint

Enhancing Spatio-Temporal Resolution of Process-Based Life Cycle Analysis with Model-Based Systems Engineering & Hetero-functional Graph Theory

Niraj Gohil, Nawshad Haque, Amgad Elgowainy, Amro M. Farid

arXiv:2506.00230, 30 May 2025 → https://arxiv.org/abs/2506.00230 (PDF: https://arxiv.org/pdf/2506.00230)

Methods: MBSE, HFGT, SysML, Python

R-03 · Preprint

Spatio-Temporal Life Cycle Analysis of Electrolytic H2 Production in Australia under Time-Varying CO2 Management Schemes

Niraj Gohil, Alexander Franke, Nawshad Haque, Amro M. Farid

arXiv:2509.00175, 29 August 2025 → https://arxiv.org/abs/2509.00175 (PDF: https://arxiv.org/pdf/2509.00175)

R-04 · Draft (not peer reviewed, not a preprint server paper)

Binding-Constraint Migration in Advanced-Node Semiconductor Supply: A Vintage-Structured Model with a Diagnostic Temporal Evaluation

Niraj Gohil

Working draft, January 2026, 7 pages

Methods: System dynamics, vintage-structured capacity model, Python

Selected figures

Results, in their own words.

Six charts from the hydrogen papers. Each opens its paper for the full story.

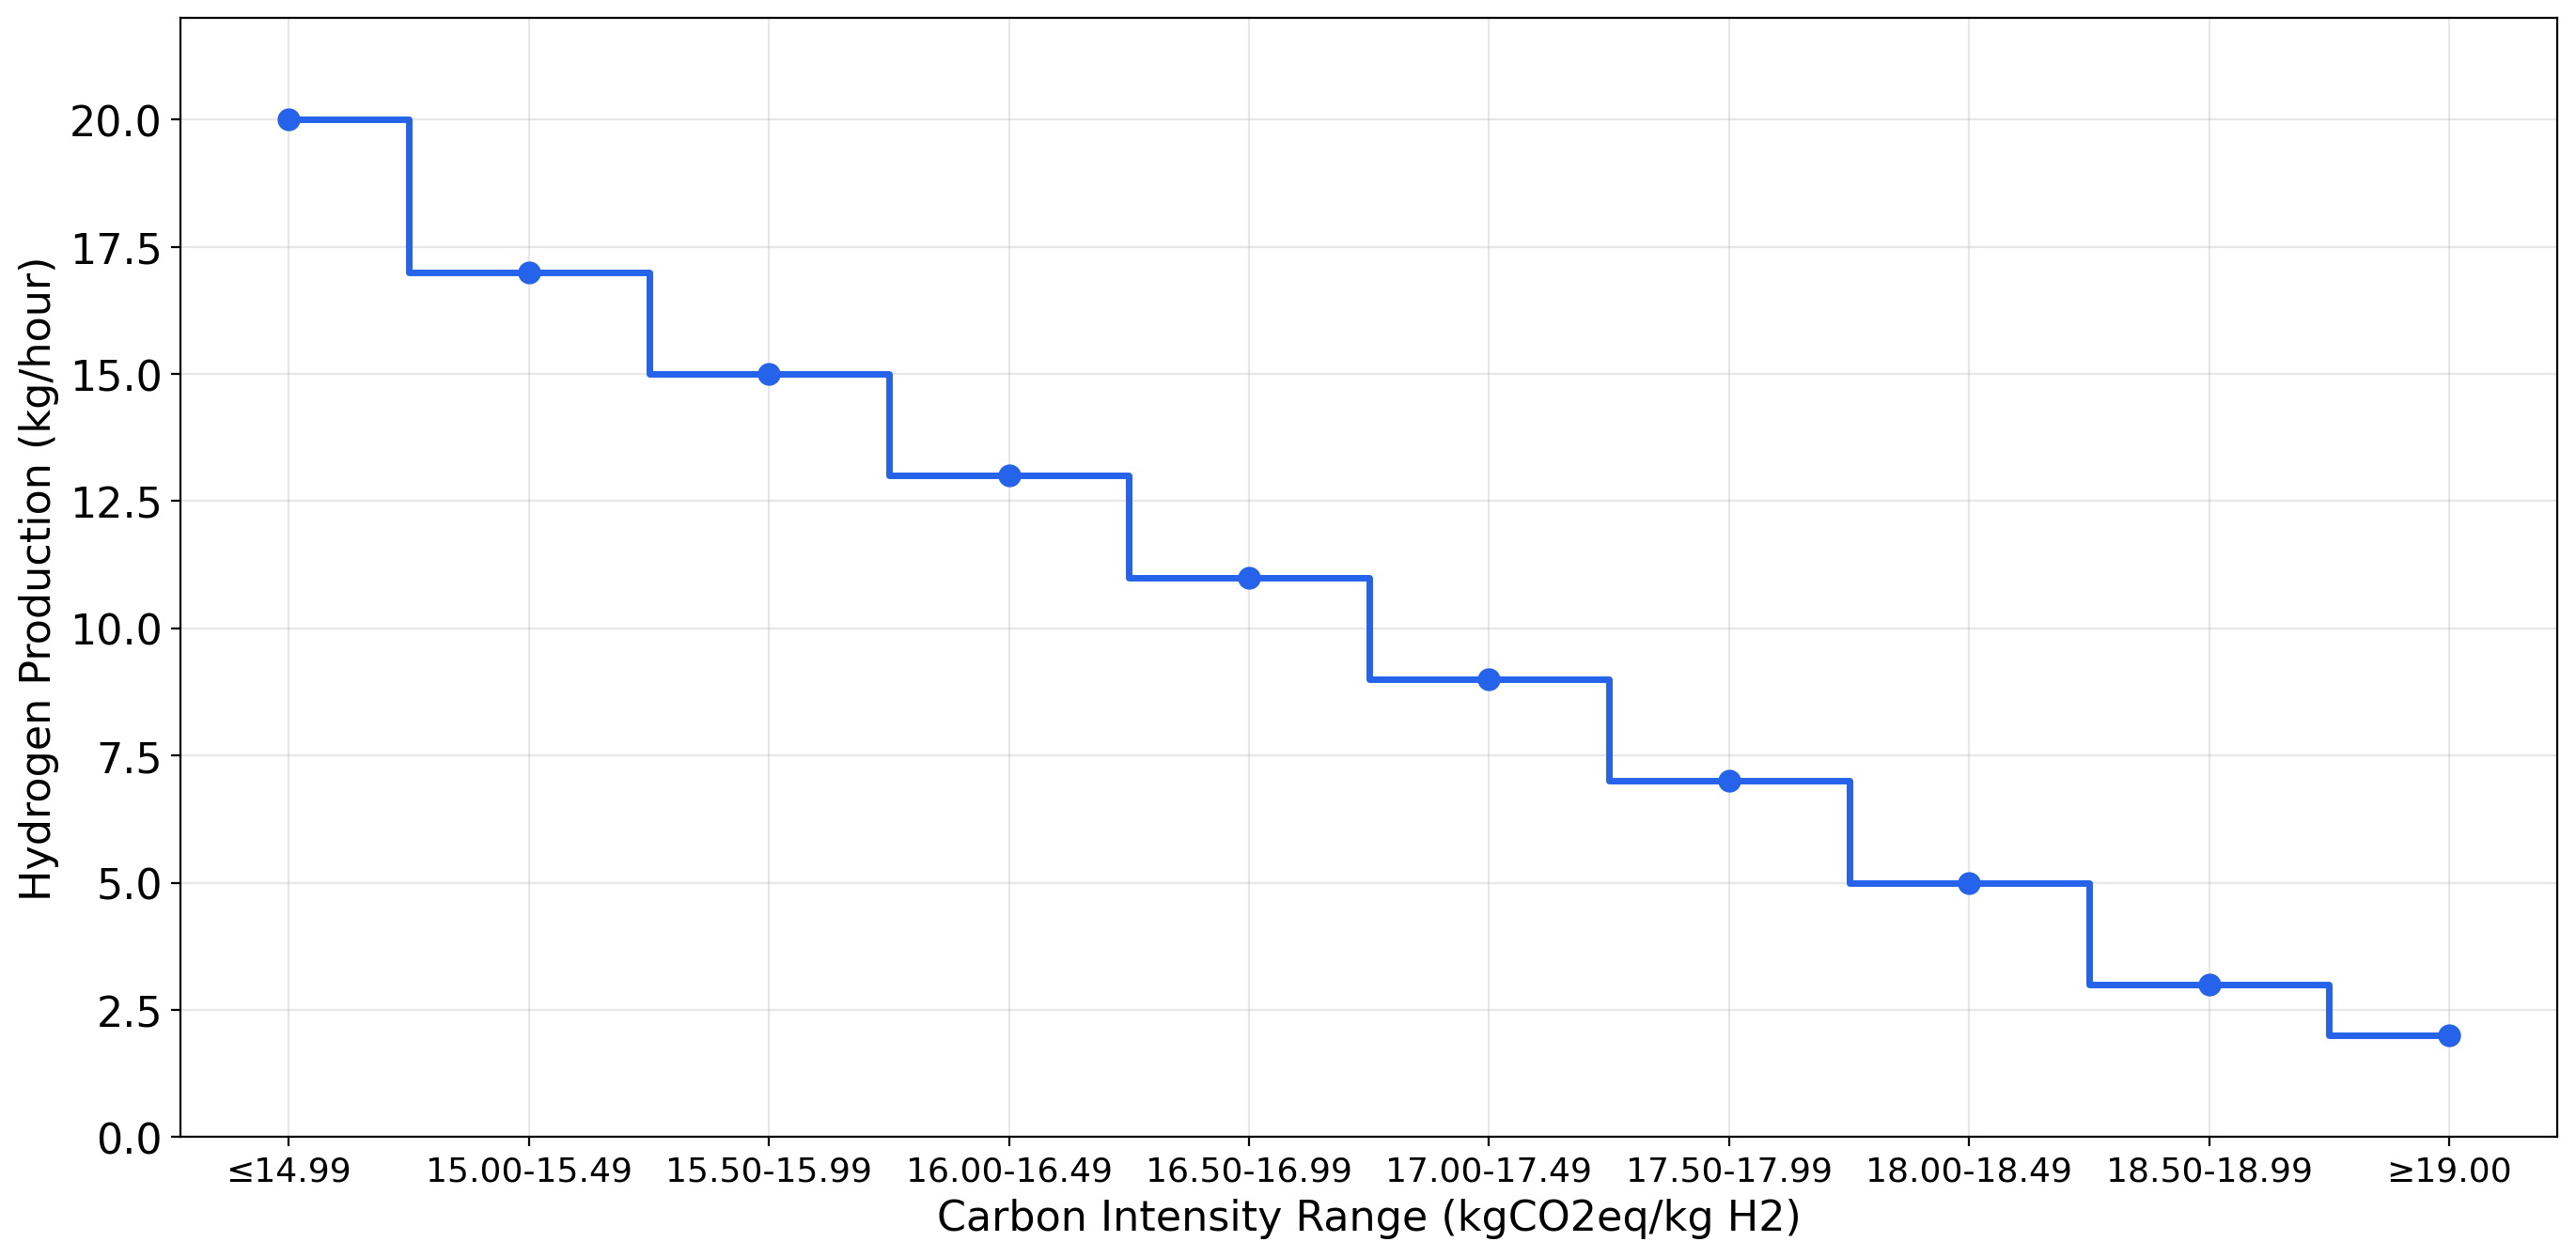
Step chart: hydrogen production rate versus grid carbon intensity range

Produce when the grid is clean.

The electrolyzer follows grid carbon intensity in tiers: full 20 kg/hour output in the cleanest hours, stepping down to 3 kg/hour when the grid runs dirtiest. This dispatch curve is the heart of carbon-aware operation.

Open the paper
Monthly hydrogen production by Australian state

Where clean hydrogen wins.

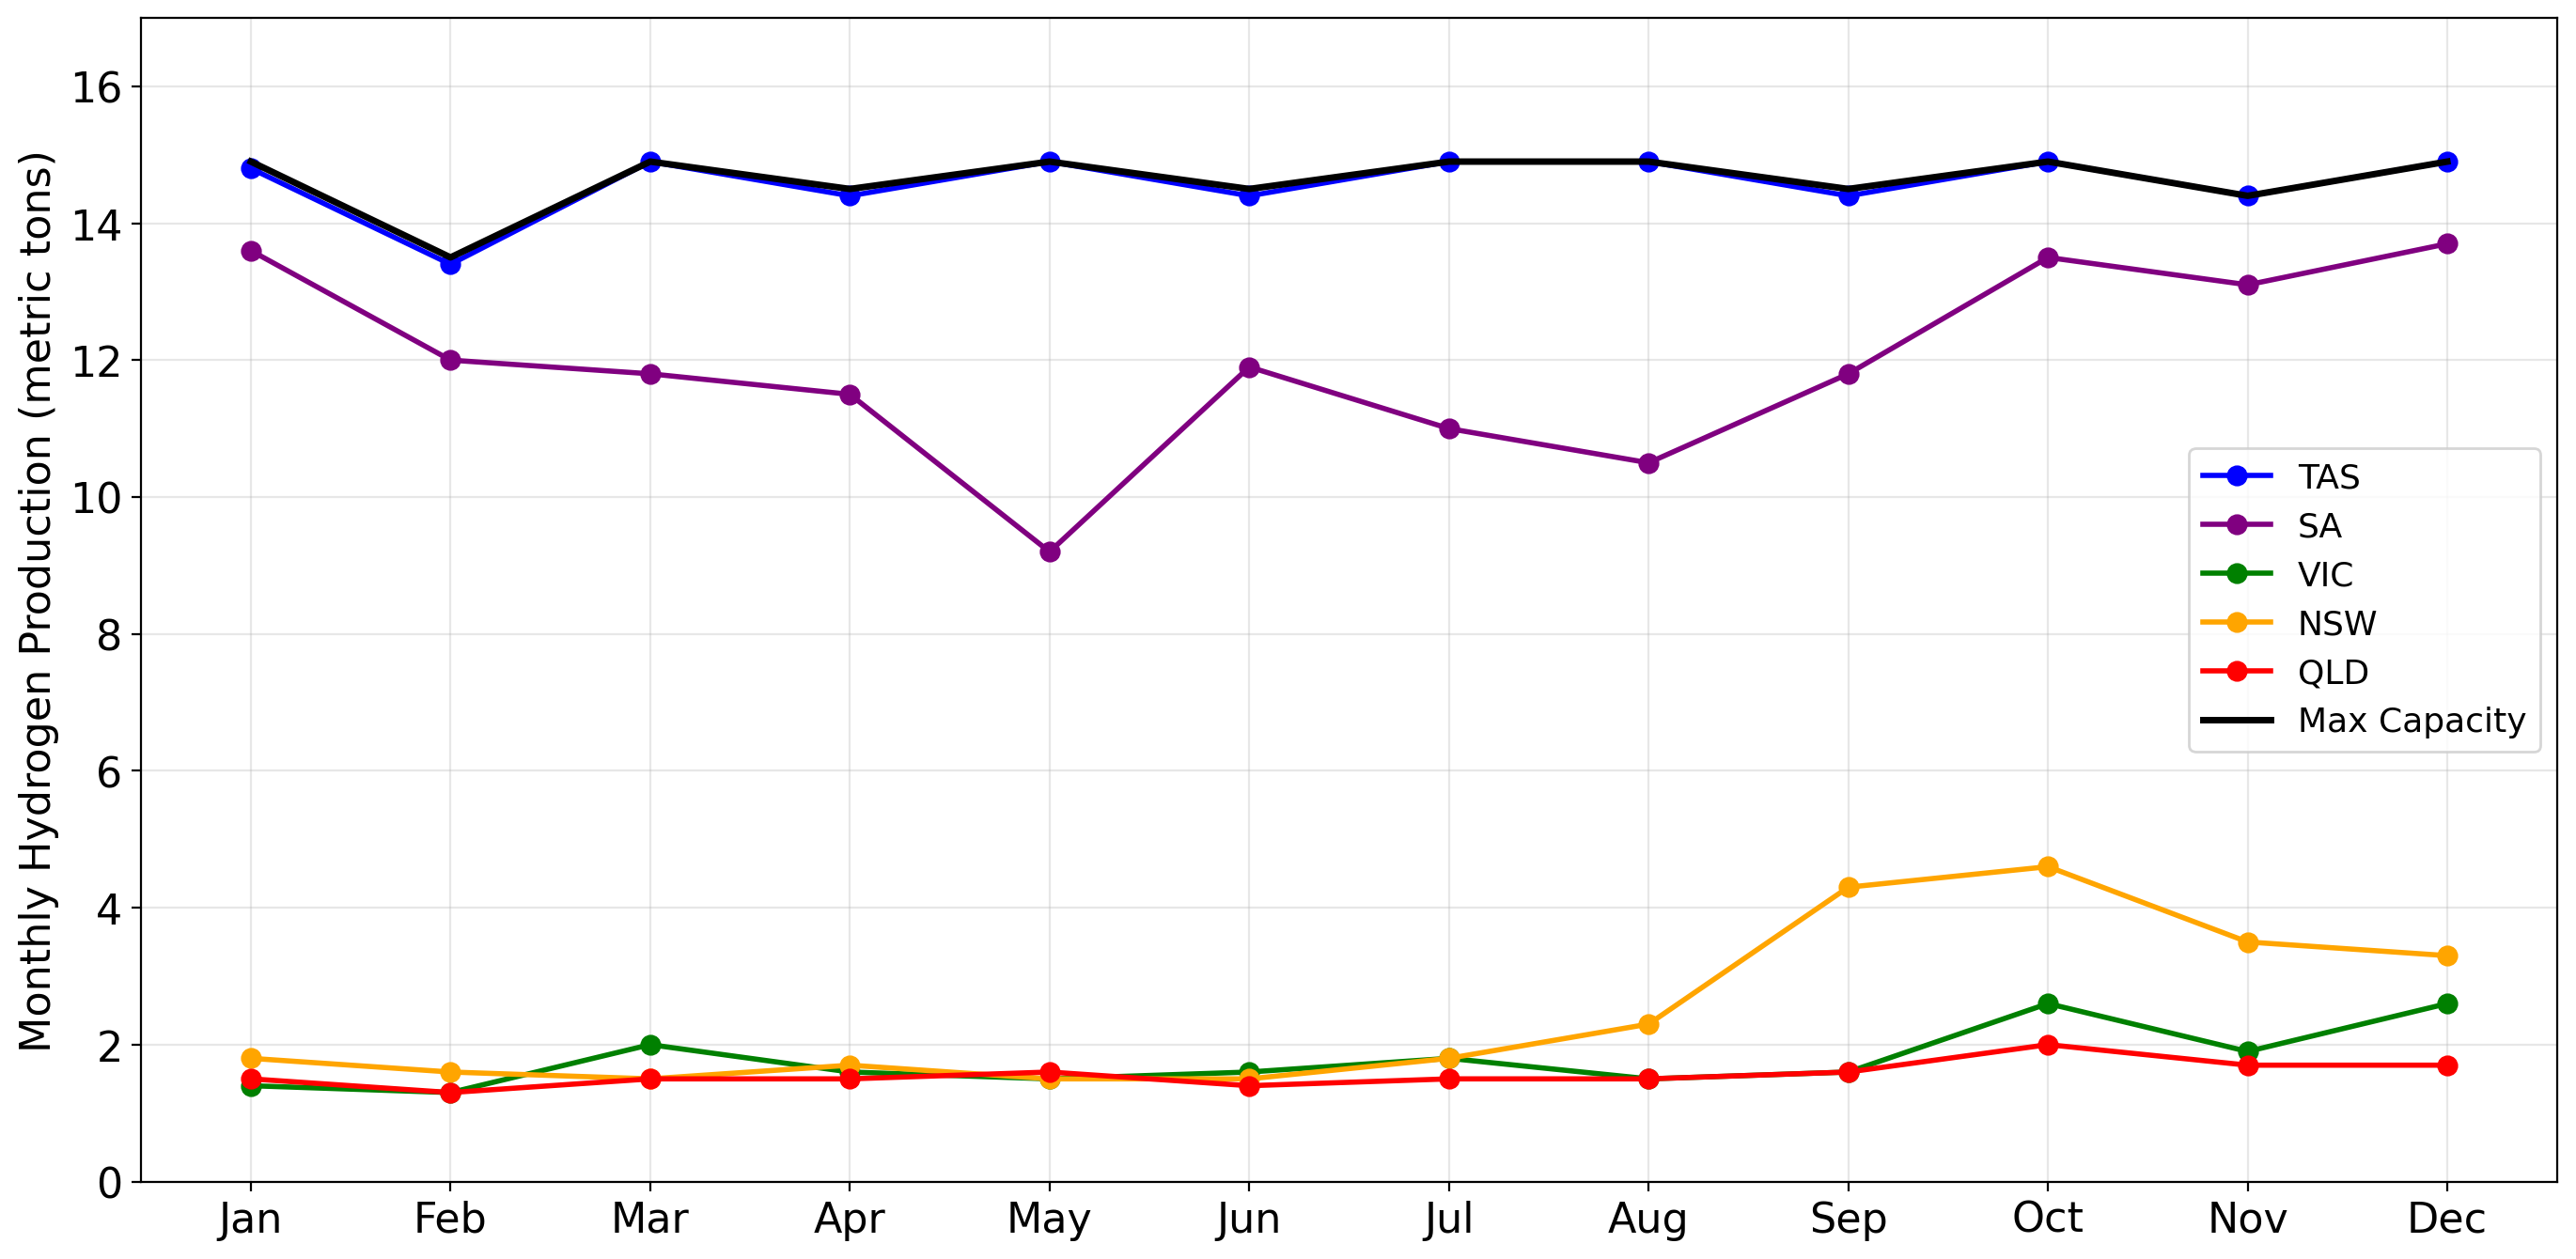
Monthly hydrogen output under variable production. Tasmania holds maximum capacity all year on its clean grid; South Australia runs high on renewable penetration; the eastern states throttle back through carbon-heavy months.

Open the paper
Monthly per-kilogram hydrogen cost by Australian state

The cost of timing.

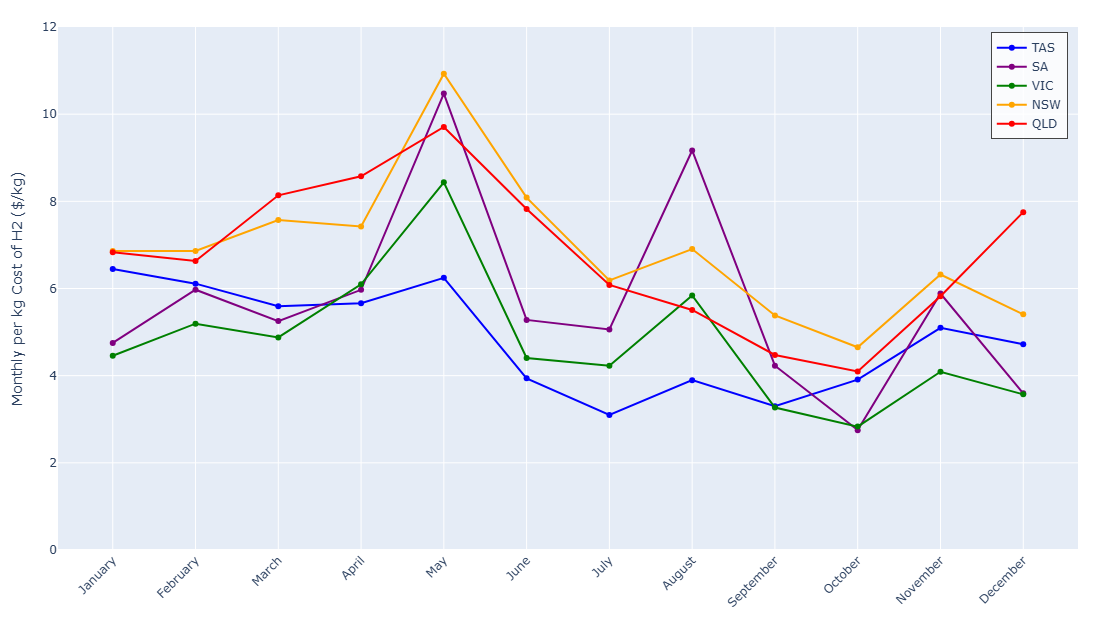
Per-kilogram production cost moves with the grid. Curtailment during dirty hours raises costs; full production in clean hours brings them down. The spread across states and seasons is the economic case for dynamic operation.

Open the paper
Monthly life cycle carbon emissions by Australian state

Emissions, cut by scheduling.

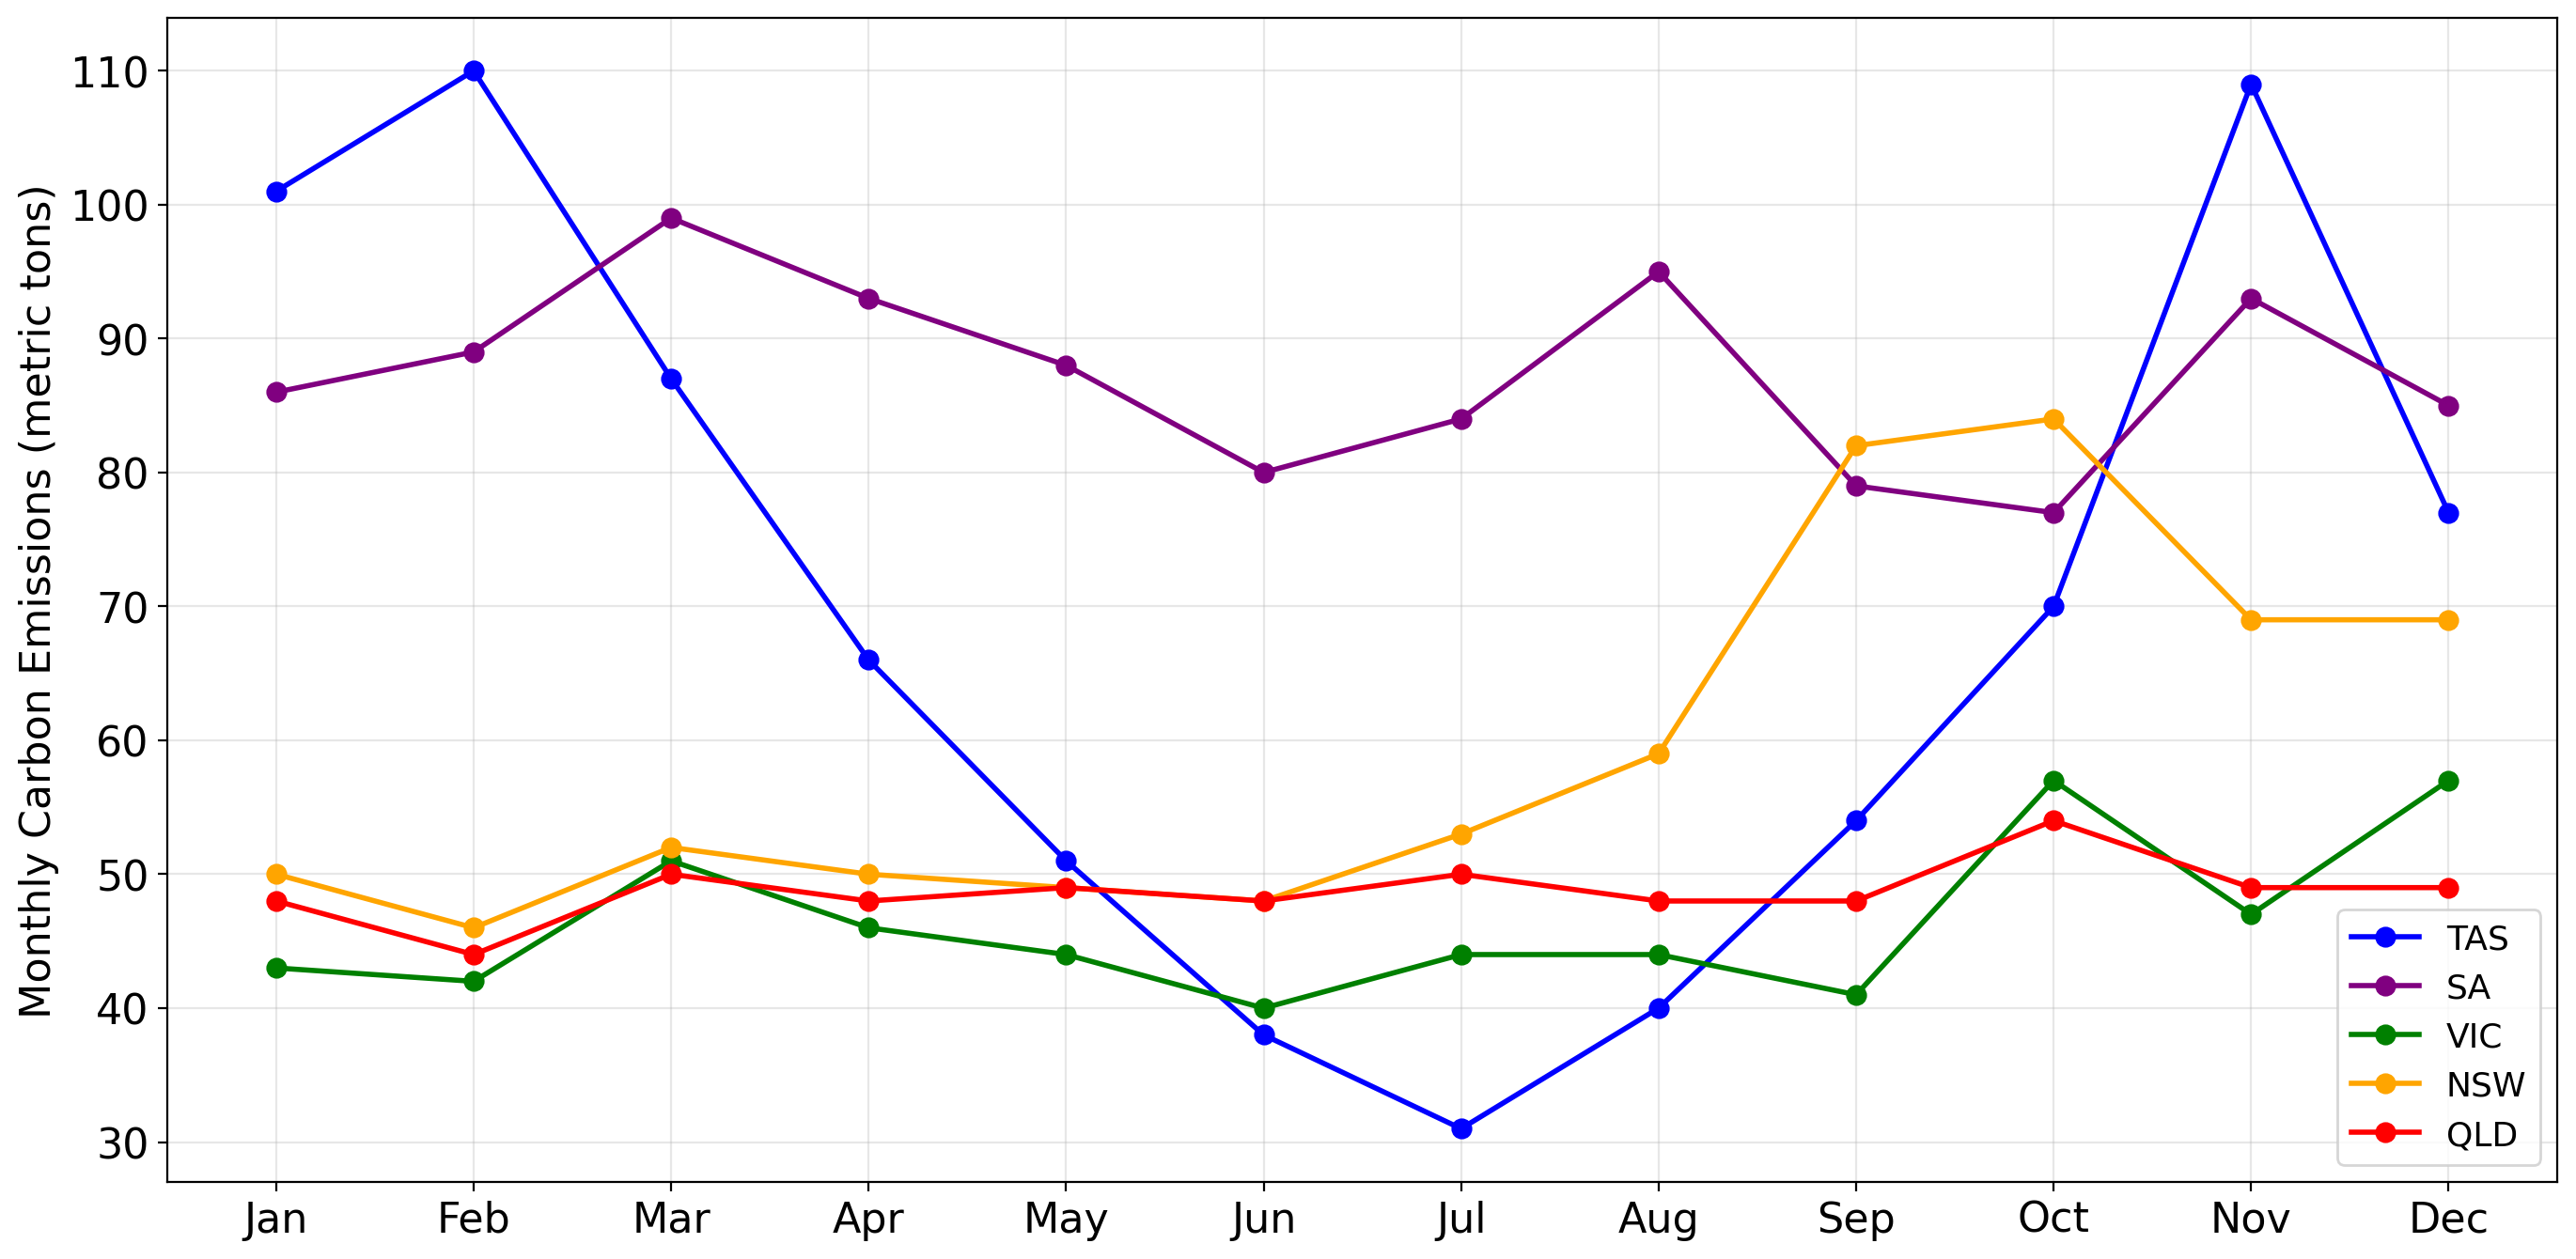
Monthly life cycle emissions under variable production. Concentrating output in clean-grid hours brings emissions down sharply against flat production, with the deepest cuts where the grid is cleanest.

Open the paper
Australia 2023 weekly average grid carbon intensity

The signal itself.

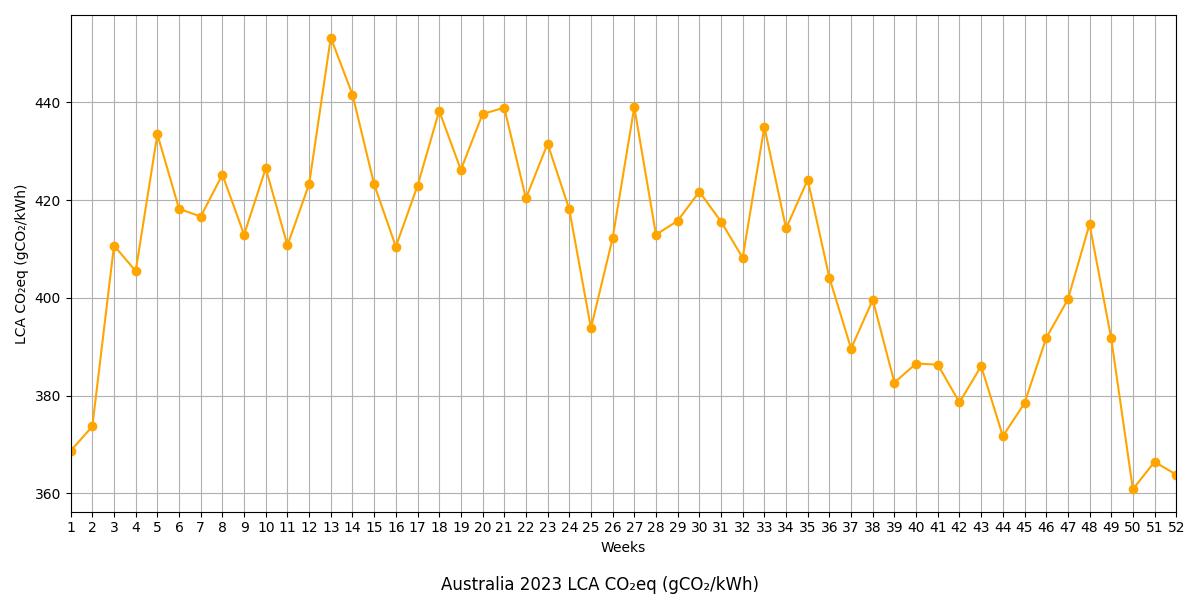
Australia's 2023 weekly average grid carbon intensity. This real-world LCA signal is the input the dispatch model reads, hour by hour, all year.

Open the paper
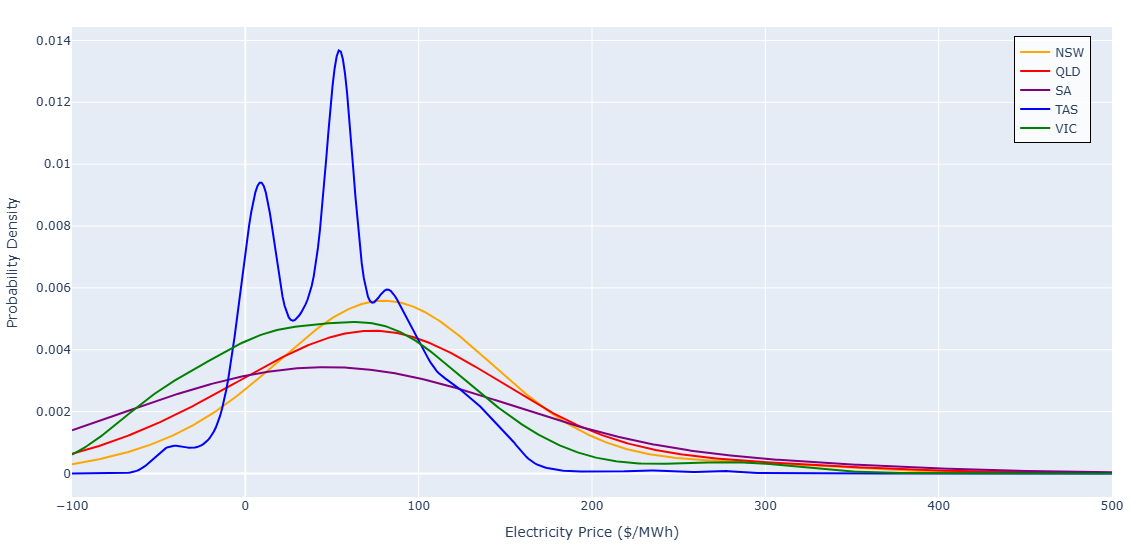
Electricity price probability distribution by Australian state

Price shapes the map.

How electricity prices distribute across states. Tasmania's tight low-price band contrasts with wider spreads elsewhere, deciding where carbon-aware hydrogen is cheapest to make.

Open the paper